A small increase can look dramatic in a chart, while a large count can conceal differences in group size. Reading well starts with a practical question: what was actually measured, and what is the comparison based on? You do not have to distrust every graphic or perform advanced statistical analysis. First reconnect the picture with the numbers and definitions it represents.
This guide provides a working method for reading charts in reports, articles and presentations. Every numerical example, table and teaching graphic here was created for this explanation. None represents a study or a real organisation's results. This AI-assisted content has not received independent human editorial review.
Give the chart an identity before interpreting its shape
Write a sentence describing the measurement: “completed transactions in each group during one week”, for example. Then identify its unit, period and population. “Activity” is not a sufficient definition: it might mean visits, people or minutes. One person could make several visits, so you cannot substitute people for visits when summarising a finding.
Locate the original data source, release date and notes beneath the chart. An article's publication date is not necessarily when its observations were collected. If a new report displays an older year's numbers, name the year of the numbers. If the measurement method changed between periods, a continuous line does not by itself establish that the real-world situation changed in the same way.
- Measure: what is counted or measured?
- Unit: counts, percentages, minutes or something else?
- Coverage: which population, location and period?
- Source: can you reach the table and definitions?
- Missing qualification: what would prevent a fair comparison?
Read the axes, colours and legend in order
Identify what each axis represents, then read its first tick, last tick and intervals. Do not assume every horizontal gridline represents ten units or every time step represents a month. Read the colour legend too. Orange might identify another group, another period or simply the item the designer wants to emphasise.
Bars compare quantities across categories; a line connects points in an order; a scatterplot assigns two values to each point. Those are descriptions of presentation, not certificates of reliable data. Joining three points does not establish what happened between them. Three bars do not explain how their counts were collected.
The teaching image: making a 5% increase look much larger
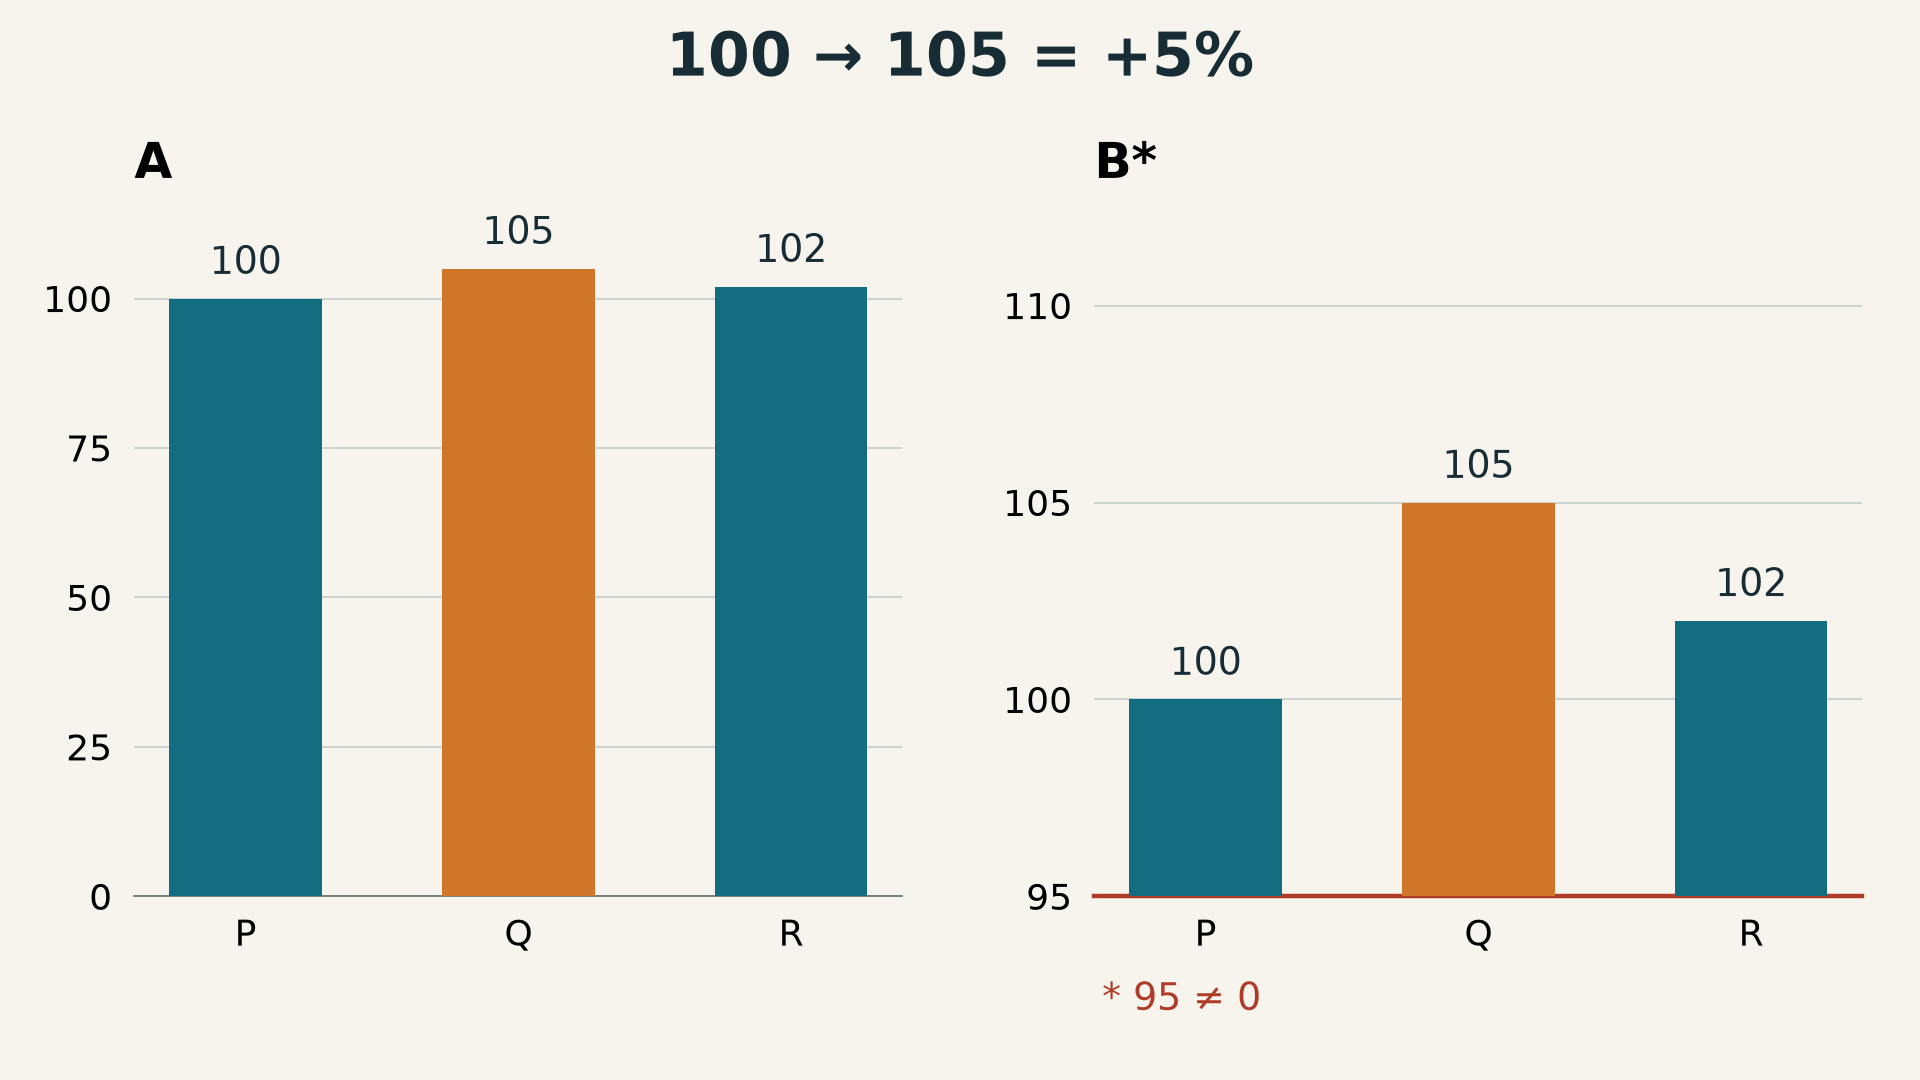
The original image for this article displays the same invented values twice: P is 100, Q is 105 and R is 102. Chart A starts at zero. Chart B, marked with an asterisk, starts at 95. B was deliberately included to demonstrate truncation; it is not a recommended example of presenting bars.
| Invented group | Value | Difference from P | Change relative to P |
|---|---|---|---|
| P | 100 | 0 | 0% |
| Q | 105 | 5 | 5% |
| R | 102 | 2 | 2% |
For P to Q, the calculation is (105 − 100) ÷ 100 × 100 = 5%. In B, however, the visible part of the first bar extends only five units above 95, while the second extends ten. The second visible bar therefore looks twice as tall even though 105 is not twice 100. The numbers stayed unchanged; the visual baseline changed.
The Office for National Statistics axis guidance distinguishes zero-based bars from line-chart considerations. Do not label every non-zero axis deceptive. Identify the chart type and whether its chosen range is clear, then return to the actual values rather than treating apparent height as a calculation.
Separate counts, percentages and percentage points
A larger count need not mean a higher proportion
Imagine two groups with 40 and 60 positive responses. If the first contains 50 respondents and the second 100, their proportions are 80% and 60%. The second group has the larger count; the first has the larger proportion. There is no contradiction. These measures answer different questions. Keep numerator and denominator alongside the percentage so readers can see the group sizes.
There are two different ways to describe 20% becoming 25%
The direct difference is five percentage points: 25 − 20 = 5. The relative increase from the starting proportion is (25 − 20) ÷ 20 × 100 = 25%. Writing “five per cent” when you mean “five percentage points” changes the claim. When the starting value is zero, the usual percentage-change calculation is undefined because it divides by zero; do not manufacture an ordinary growth percentage.
Reversing a comparison also changes its percentage. Moving from 100 to 105 is a 5% increase. Moving back from 105 to 100 is approximately a 4.76% decrease. Both absolute differences are five units, but the denominators differ. State the starting point instead of giving an unexplained “difference”.
Check time intervals and gaps before describing a trend
Consider invented values of 10 in January, 12 in February and 18 in May. The first increase is two units in one month; the next is six units over three months. Equally spacing those three observations could suggest an acceleration that this simple calculation does not establish. We know the observed points, but not the missing March and April values or how regularly change occurred inside either interval.
Distinguish a blank from zero. Zero is a recorded value. A blank might mean no measurement, unavailable information or a measure that does not apply. Do not replace it with zero merely to make a chart easier to draw. Also check whether values describe separate months or an accumulated total. An increasing cumulative total does not establish increasing monthly additions.
For example, invented additions of 10, then 5, then 2 produce cumulative totals of 10, 15 and 17. The cumulative line rises every time, while the additions shrink. Identify the series explicitly before explaining its direction. If the source does not tell you which series you are reading, that uncertainty belongs in your summary.
Do not let area or colour replace the numbers
When circles are used, ask whether their areas or diameters encode the values. Doubling a diameter makes the area four times larger, because area varies with the square of diameter. A large circle can therefore create a different impression from a nearby label. Do not estimate a ratio from the shape alone when the legend leaves its encoding unexplained.
For two vertical axes, read each series against its own scale. Lines crossing on the screen do not establish equal values if the units or tick intervals differ. A scale showing 1, then 10, then 100 at equal distances multiplies by ten at each step rather than adding a fixed amount. Recognising that operation helps you read it; it does not make any one scale suitable for every situation.
Separate observed patterns from possible explanations
“Two values increased together” describes a pattern. “The first caused the second” adds a claim the chart alone does not supply. Evaluating that claim may require the study design, sequence of events and other variables. Preserve the distinction in your writing: describe the co-movement, and call an explanation a hypothesis when the necessary evidence is unavailable.
If bars or shaded regions surround values, read their definition instead of automatically calling them a margin of error. They may represent a range or a particular statistical quantity defined by the source. If that definition is missing, say the shading is unexplained. Do not turn overlapping bands into the result of a statistical test the report has not provided.
A practical check before sharing a chart
- Save the source link and data period, not just a cropped screenshot.
- Describe the measure, unit and population in one sentence.
- Copy two or three values from the table or direct labels.
- Calculate one absolute difference and one percentage, recording the denominator.
- Inspect axis starting points, gaps and colour definitions.
- Write one sentence about what is visible and another about what cannot be inferred.
- If a fundamental definition remains unknown, request it before sharing a confident conclusion.
For our example, a defensible summary is: “Q exceeds P by five units, or 5% relative to P, in invented data.” It is not “Q performs twice as well as P”, and it does not establish why the difference exists. Keeping the table makes corrections straightforward and prevents a visual misunderstanding from turning into a misleading headline.
Questions for incomplete information
What if there is no downloadable table?
Use direct numerical labels where available, and identify any value read from axis positions as an estimate. Do not report precise decimal places when you only judged a position by eye. If your conclusion depends on a small difference that cannot be distinguished, request the data rather than guessing the missing precision.
Is a familiar source enough?
A familiar source can help you trace the methodology, but it does not remove the need to check coverage, updates and definitions. A circulating image might be old or cropped from an otherwise accurate publication. Return to the complete version and compare the accompanying headline with what the numbers actually support.
References and limits of this guide
The House of Commons Library guide to potentially confusing charts provides further reading on presentation choices. Both references were consulted on 1 November 2026. Our numbers, table, graphic and calculations are independent teaching examples, not copied source examples. This reading method does not replace assessment of a study's methodology when a decision depends on it.