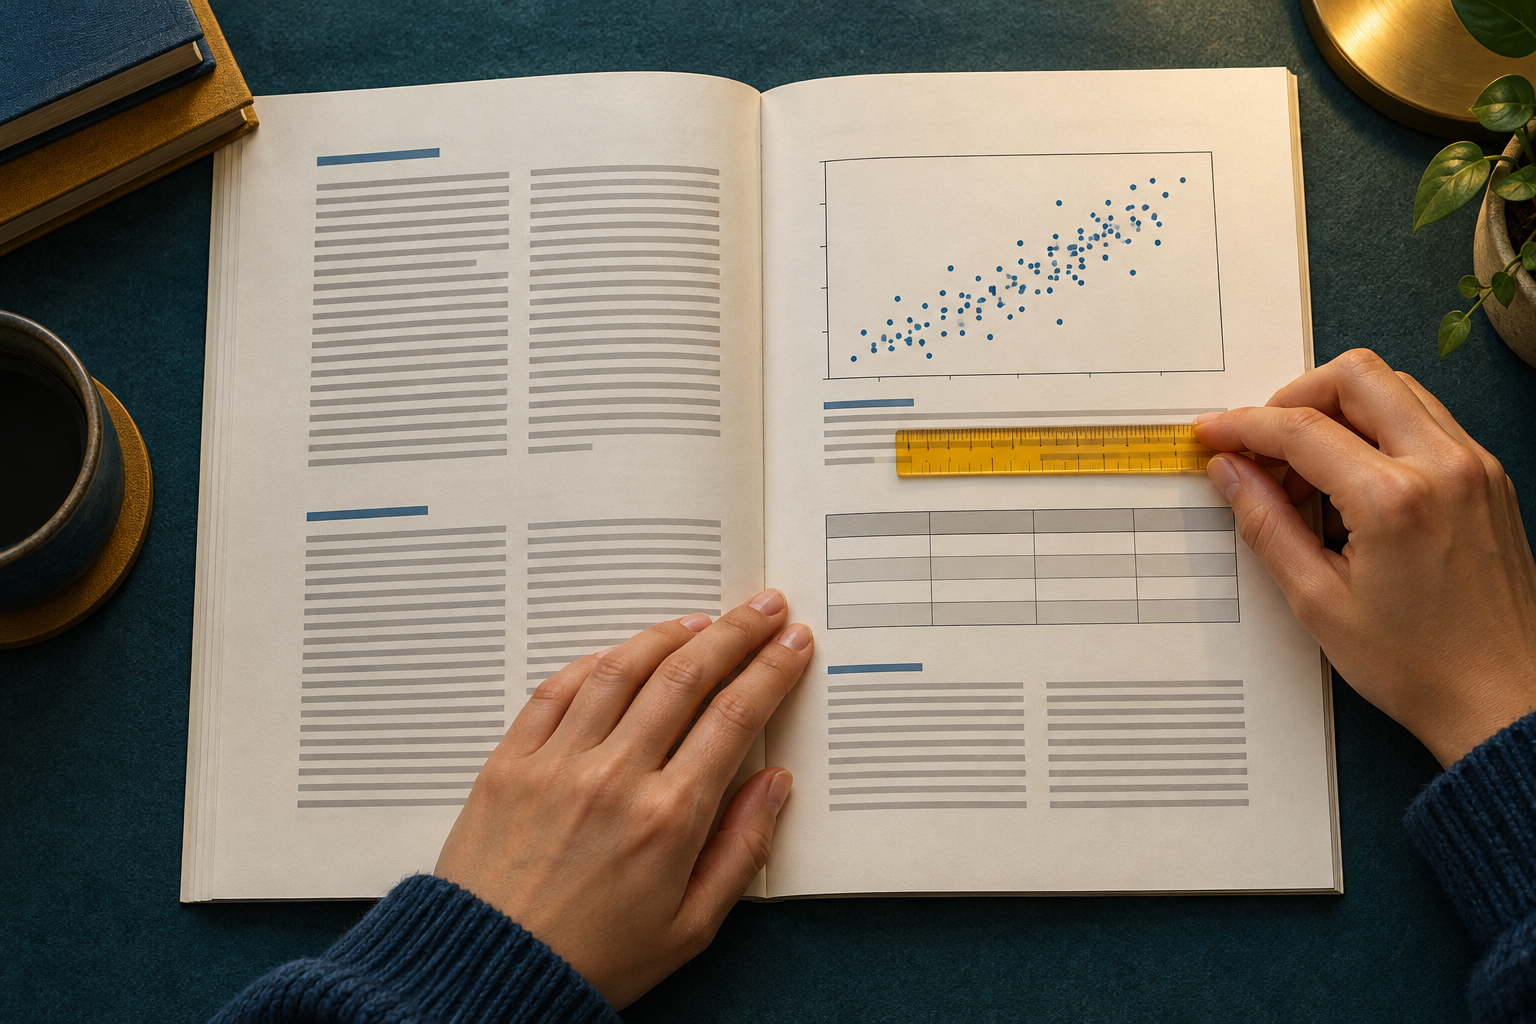
A news headline can lead you to a scientific paper full of terminology, figures and tables that look very different from the news report. You do not have to understand every detail immediately, but the abstract alone is not enough to judge a result. Useful reading starts with the question you want answered, then connects the answer to what the researchers actually measured and the limits they described.
This guide offers a way to record what you understand and what remains uncertain. Its paper-absorbency example is invented and does not represent a published study. The purpose is to read and document evidence, not to certify professional peer-review skills or turn one study into medical, financial or other specialist advice.
State your reason for reading in one sentence
Are you looking for a definition, trying to understand a measurement method, or checking a claim repeated elsewhere? Write a sentence such as: “I want to know whether this research measured the outcome mentioned in the news report.” This gives you a point of return when numerous details compete for your attention without directly answering your question.
Ten simple rules for reading a scientific paper, published in PLOS Computational Biology, highlights the value of identifying your purpose and understanding the authors' aims. That general idea is a starting point here; the worksheet and examples below are independently developed, rather than reproductions of the source's rules or tables.
Match your intended outcome to your expertise. On a first reading, identifying the question, measurement method and location of the result may be a useful achievement. You need not evaluate every statistical choice immediately. If your question requires expertise you do not have, record that gap instead of using terminology you cannot explain to make your conclusion sound more certain.
Check the document type and version
Save the title, authors, publisher, date and available link or persistent identifier. Read how the publisher describes the material: original research, a review, commentary, protocol or something else. Not every document containing references is an experiment. The kind of material affects the questions you can reasonably ask of it.
If you arrived at a standalone file, visit its publisher page and look for version information or linked correction notices. Do not assign a status you have not verified, such as peer reviewed or latest version, from the page's appearance alone. Record the status you actually found and where you found it. Leave unresolved matters in your questions column.
When comparing a news report with the paper it cites, establish that you have the same paper. A similar title or overlapping author names is insufficient. Keep the news link and research link separate so that each claim can be attributed to the place where you actually read it.
Understand the sections before pursuing details
The University of New Mexico Libraries guide to reading original research articles describes common sections and a strategic approach that allows movement between them. An introduction situates a question, methods describe how the work was done, results present findings, and discussion addresses interpretation and limitations.
This is not a compulsory template for every discipline. Use the paper's actual headings to locate information. When results and discussion are combined, do not assume that either evidence or interpretation is missing. Read the paragraphs and identify which statements describe an observation and which propose what it means.
| What you need | A useful reading note | What remains open |
|---|---|---|
| Research question | Your own wording and its location in the paper | A term you do not yet understand |
| Method | What was studied and how it was measured | A detail needing an appendix or expert explanation |
| Result | The measure, unit and comparison presented | Whether you understand the measure correctly |
| Limitations | Constraints identified by the authors | Possible additional limits you have not established |
Map the paper before judging it
On your first pass, use the title and abstract to assess relevance, then notice the headings, tables and supplementary materials. Write down the locations you expect to revisit. You do not need to copy whole pages. A section heading or figure number, recorded as it appears in the document, can be enough to help you find something later.
Next, write a short provisional summary labelled “initial understanding.” Keep this separate from the authors' exact words and mark any direct quotations clearly. Otherwise, when you revisit your notes, your own paraphrase can accidentally become a statement attributed to the researchers.
If the paper does not answer your question, retain the reason for excluding it. For example: “This measures the material in a laboratory; my question concerns outdoor use.” That is a specific relevance judgment. It does not establish that the study is weak or worthless simply because its scope differs from your purpose.
An invented example: comparing water absorption in two papers
Imagine an educational report comparing two kinds of paper in a classroom experiment. Its title says the first absorbed more water under specified conditions. There is no real study or university finding behind this example. It was constructed to show what you should ask before restating a result.
Start with the unit of comparison. Were the pieces equal in area, equal in mass, or whole sheets of different sizes? Then look for exposure time and the measurement method. The title may not supply these answers. Do not expand a short title into a universal claim such as “the first paper is always better for every use.”
If you have not found the piece size, the accurate note is: “I did not find a description of the size in the section I read.” Do not replace it with “the researchers failed to standardise size” before checking the methods and supplement. The first statement describes the limits of your reading; the second claims knowledge of the procedure that you may not possess.
Record a result without broadening its scope
You could write: “Under the conditions described, the reported measurement differed between the samples; I still need to understand how the pieces were selected.” Retain the name of the measure rather than replacing it with “quality.” Price and durability might also matter to a paper user, but the invented comparison did not examine those questions.
Add a next-action column: revisit preparation details, read the table explanation or ask a teacher for clarification. An uncertainty then becomes a concrete task. It does not become an invitation to fill the gap with a personal assumption that may later circulate as a fact.
Read figures with their labels and units
For a figure, record what each axis represents, its units and the meaning of colours or symbols according to the caption or key. Do not assign a colour a familiar meaning from another chart. If a figure contains several panels, examine each separately before combining them into one conclusion.
Locate the values you need: are they in the plot, a table or a supplementary file? A value estimated visually should be identified as approximate rather than presented as an exact transcription. Similarly, the apparent length of a bar does not establish the size of an effect without attention to the axis scale and the description of the data.
If you encounter an unfamiliar statistical symbol, record it and find a reliable explanation suited to the context, or ask someone qualified. This is more accurate than converting an unfamiliar symbol into “important” or “certain” by impression. This guide does not supply calculation rules for assessing statistical significance or research-design quality.
Build a traceable chain from claim to evidence
Select one claim you want to summarise and record where the paper supports it. Does the paragraph point to a figure? Does that figure correspond to a procedure in the methods? Do limitations in the discussion change how you should phrase the claim? Another reader should be able to follow your path without relying on your general confidence in the publication.
Distinguish what was measured, what the authors infer and what you propose as a further question. Do not blend them into an unlabelled paragraph. Small headings such as “reported result,” “authors' interpretation” and “my question” can help. This organisational distinction does not make your alternative explanation correct merely because you have written it down.
Handle the parts you still do not understand
Prioritise uncertainties by their importance to your purpose. An unfamiliar equipment term may not prevent you from identifying the research topic. Not understanding the main outcome measure may prevent any faithful summary of the result. Begin with what could change your conclusion and return to less relevant details when needed.
When seeking help, provide a specific location and question. “Does this measure describe an individual sample or an average?” is easier to address than “Explain the whole paper.” Do not upload private data or material you lack permission to share to an external service simply to obtain a faster explanation.
Check your summary before sharing it
- Identify the document type and version as actually verified.
- State the research question without adding an unmentioned objective.
- Connect the result to the measure and conditions you read.
- Separate quotations from your explanation and questions.
- Keep limitations and unresolved understanding visible.
- Include the paper's link, not only a news report about it.
- Do not turn an example or individual study into specialist advice beyond its scope.
This checklist does not judge whether the research is true or original. It helps make your summary reviewable and shows readers what you actually consulted and what you have not yet been able to establish.
References and illustration
The 2020 PLOS guidance by Carey, Steiner and Petri and the University of New Mexico Libraries guide were consulted for the original article on 1 November 2026; their links appear in the text. The paper example and reading worksheet are original illustrations. The generated image contains symbolic pages and charts, not a reproduced study or evidence of real data. This edition was prepared with AI assistance and has not received independent human review.