A weather app may display one pressure number while a nearby station displays another. Before deciding that a device is faulty, check whether the values use different units or times, or whether one describes station pressure and the other a calculated sea-level value. Those details are more useful than memorising one number as a permanent sign of rain or clear skies.
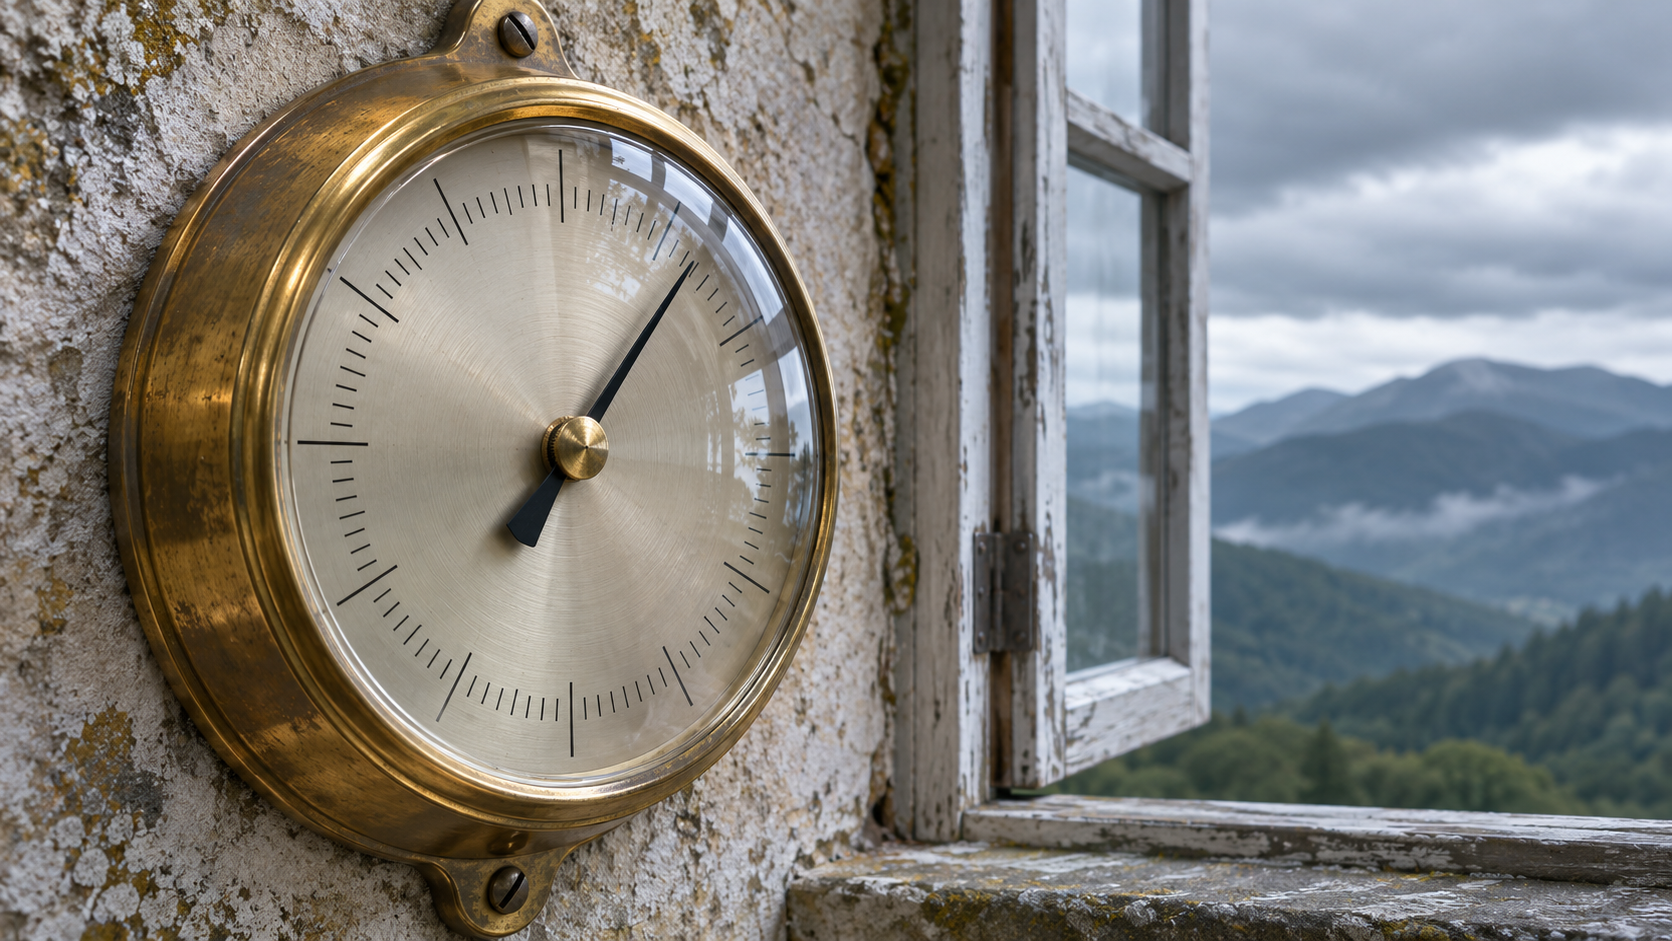
This guide explains how to read data and organise comparisons using independent hypothetical arithmetic. It is not a forecast, calibration procedure or aviation guide. The generated image shows a fictional barometer without numbers; it records neither a measurement nor a product test. This AI-assisted content has not received independent human editorial review.
Identify the pressure type before comparing the number
The National Weather Service pressure definitions distinguish pressure at a station's elevation from pressure estimated for sea level. Do not interchange them just because both interfaces use the word “pressure”.
Write down the field name given by the source. If an app does not explain it, mark the comparison “type unspecified” rather than choosing a definition yourself. You may also encounter an altimeter setting; do not automatically treat it as the same field. This article does not explain how to configure aircraft instruments or make a household reading into an operational reference for aviation.
The practical rule is that compatible meaning comes before similar numbers. Two values might happen to look alike without being directly comparable. Two valid values might differ because they describe different references. Decide what each represents before trying to explain the difference.
Keep the unit with every reading
Do not record “1012” on its own. Preserve the source's unit, timestamp and value type. A hectopascal, hPa, equals one hundred pascals, Pa; a kilopascal, kPa, equals one thousand pascals. Thus 1012 hPa equals 101200 Pa and 101.2 kPa. This is a unit conversion, not a change in the weather.
If one record shows 1012 hPa and another 101.2 kPa, do not directly subtract the displayed numbers. Convert to a common unit first. The values then agree numerically on the same reference, provided their other definitions also match. Converting units does not convert station pressure to sea-level pressure: these are separate operations.
Keep the original value alongside the converted one. This makes a misplaced decimal easier to trace without reopening the source. When a unit is unknown, do not guess it just from the size of the number. Marking an unresolved field is more useful than introducing an invisible assumption into the record.
Build a small record before interpreting a trend
The following table is invented for teaching, not a city's observations. Assume that all three values come from the same source, describe the same pressure type and use the same unit, date and time zone. The two intervals deliberately have different lengths so that the role of elapsed time is visible.
| Invented time | Assumed reading | Difference from previous reading | Interval |
|---|---|---|---|
| 09:00 | 1014 hPa | No previous reading | — |
| 12:00 | 1011 hPa | −3 hPa | 3 hours |
| 13:00 | 1010 hPa | −1 hPa | 1 hour |
Between 09:00 and 12:00, the value falls three units in three hours: an average change of −1 hPa per hour. Between 12:00 and 13:00, it falls one unit in one hour, giving the same average rate. Comparing −3 with −1 without the interval might suggest different rates of change that this example does not establish.
From beginning to end, the difference is 1010 − 1014 = −4 hPa over four hours. However, these observations do not describe every minute between the recorded points. There could have been unrecorded variation. Do not draw detail that was not measured or turn an interval average into a claim of perfectly steady change throughout.
The present value and the direction of change are different information
Imagine two more teaching records ending at 1010 hPa. One starts at 1014 and ends at 1010; the other starts at 1006 and ends at 1010 over the same interval. Their final value matches, but the first difference is −4 and the second +4. Describing a direction therefore needs at least two dated points; the final number alone cannot establish it.
The Met Office explanation of pressure measurement discusses reading types and tendency in observation data. Here we use the distinction between fields without turning our examples into official categories or predictions. Keep the difference and interval separate so that the calculation's basis remains visible.
If you move an instrument or change its reference setting during a record, annotate the change or start a new series. Combining before-and-after values without that note can make a setting change look like a weather change. A tidy spreadsheet cannot compensate for an undocumented change in what its columns mean.
Why two apps cannot quickly settle a question of accuracy
Suppose one screen displays 1011.4 and another 1011. The display difference alone does not establish a measurement difference: the second might show a rounded number. If the first observation is from 12:00 and the second from 11:00, the timing creates another reason not to compare them directly, even when the units match.
Check in order: pressure type, unit, location, observation time, screen-update time and display method. Loading a webpage does not necessarily mean its measurement was taken at that instant. When “last updated” is not defined, do not assign it a meaning that the site does not provide.
After matching these elements, you can record a difference as something requiring explanation. Declaring a device more accurate or an organisation wrong needs a suitable reference and test method, not a screenshot alone. This article contains no laboratory comparison and makes no buying recommendation.
Do not turn a single value into a weather promise
Our table supports the statement that its assumed values fell during a defined period. It does not tell us tomorrow's rainfall amount, the time rain will start or the wind speed. Those conclusions go beyond the information supplied, even if a short headline makes the connection sound simple.
For a near-term decision, consult current official forecasts and appropriate local warnings. Use a pressure record to understand the field you are reading, not to replace forecasts or alerts. If an app displays a sun icon beside a number, the icon is not an adequate explanation of how its prediction was produced.
A practical record that does not invent missing data
- Record the source name and link, or the instrument's name and model for a personal measurement.
- Include date, time and time zone; separate observation time from the time you viewed it.
- Copy the pressure type and unit exactly, marking ambiguity instead of concealing it.
- Keep the original value and any conversion together with its equation.
- Note instrument movement, setting changes and interruptions.
- Calculate differences and intervals only between readings with compatible definitions.
Your first record need not be elaborate. What matters is being able to explain every column a week later without relying on memory. Leave missing information missing rather than entering zero. Zero is a number with a meaning, not another name for unavailable information.
Common questions about readings and comparisons
Should I adjust an instrument until it agrees with an app?
Not on the basis of an unexplained difference. Establish the reading type and reference first, then follow the manufacturer's instructions when configuration or checking is required. This guide supplies neither a calibration procedure nor a certified reference, and does not ask you to open an instrument or adjust its internal parts.
Do more decimal places mean greater accuracy?
The number of displayed digits describes presentation and does not alone establish measurement quality. Writing 1011.400 instead of 1011.4 adds no information about how the measurement was made or its uncertainty. Read the source specifications rather than judging the measurement by the number's appearance.
Sources and limits of the examples
The linked National Weather Service and Met Office pages were consulted on 2 November 2026. All numerical series and differences here were created independently for this explanation. They are not actual observations, forecasts or barometer tests. No reference organisation's photographs were reused, and the invented examples are not attributed to those organisations.