If one weather app displays a wind speed of 20 and another displays 35, you cannot establish a disagreement until you read the units and field labels. One value might be a mean speed and the other a gust, or the services might use different units. Start by identifying what the number describes, then its location and reporting period.
This guide explains speed, gusts and direction using independently constructed calculations and fictional examples. It contains no live observations or forecast for your location. It does not establish safe limits for outdoor activities, flying or boating. Activity decisions need the relevant official forecast and organiser's instructions, not a generic arithmetic example.
Separate mean speed from gusts
The Met Office forecast guide distinguishes the mean wind speed from gust information. Actual wind varies above and below a mean; a gust is a brief peak rather than a constant speed throughout the period. Products can use different reporting or averaging periods, so check the definition supplied by the service instead of assuming one rule for every app.
Make two columns in your notes: “mean” and “gust”. Do not add them to invent another speed, or treat a gust as the day's average. In a fictional example, a mean of 10 metres per second and gusts of 15 metres per second do not describe a speed of 25 metres per second. They are different descriptors in the displayed information.
Direction tells you where the wind comes from
The meteorological direction convention names the origin: an easterly wind comes from the east. The Met Office measurement guide explains this convention relative to true north. An app's arrow still needs its own legend: it may show movement while a letter indicates the direction of origin.
To avoid reversing the meaning, first write the complete phrase, such as “wind coming from the west”. Add the source's symbol afterwards if useful. If a map can rotate, do not assume that the top of the screen is north without checking its orientation. A cropped screenshot containing only an arrow is not enough to establish its intended meaning.
When a letter and an arrow look different
The Met Office interface guide gives an example in which an arrow points north while the letter S identifies a southerly wind. Those representations agree within that interface. Do not automatically transfer that behaviour to another service. Read its symbol explanation, especially if the arrow rotates with a map or forms part of an animation.
Convert units before comparing numbers
Forecasts can show kilometres per hour, metres per second, miles per hour or knots. Keep the original unit beside each copied value. Treat an unidentified unit as missing information rather than choosing whichever unit brings the number closest to another app's result.
Multiply metres per second by 3.6 to obtain kilometres per hour; divide kilometres per hour by 3.6 for the reverse conversion. There are 3,600 seconds in an hour and 1,000 metres in a kilometre, so the factor is 3,600 ÷ 1,000 = 3.6. This changes the unit, not the forecast model.
| Fictional starting value | Calculation | Converted value |
|---|---|---|
| 5 m/s | 5 × 3.6 | 18 km/h |
| 10 m/s | 10 × 3.6 | 36 km/h |
| 15 m/s | 15 × 3.6 | 54 km/h |
| 72 km/h | 72 ÷ 3.6 | 20 m/s |
The factor 3.6 is not a conversion between knots and kilometres per hour, or between miles per hour and metres per second. When using a converter, select the full unit name if an abbreviation is unclear. As a check, convert the result back to its starting unit. If it does not reproduce the original within rounding, review the inputs.
A comparison that exposes a common mistake
Imagine service A displays a mean of 10 m/s and gusts of 15 m/s. Service B displays a mean of 36 km/h and gusts of 54 km/h. After conversion, the numbers match. There is no remaining numerical discrepancy in this invented example; the difference was the presentation.
Matching values do not prove that two services share their data source or methodology. You still need aligned locations, periods and report types to compare the products. If B instead reports a mean of 40 km/h, preserve the remaining difference. Do not edit a value to force agreement or invent an explanation unsupported by the information available.
A useful comparison sheet therefore retains both original values and both converted values. A reader can check your arithmetic without having to trust a single rewritten number. If you rounded a displayed result, state that choice and keep the unrounded working value where practical.
Location, height and reporting period matter
The Met Office measurement guide describes the influence of exposure, surrounding obstacles and height, and the use of specialised wind instruments. A personal impression in a sheltered corner is not a replacement measurement for an exposed observing station. This is a reason to identify the comparison context, not to declare either reading wrong.
Give your worksheet a station or forecast-location field and a reporting-period field. Comparing an hourly value with a daily maximum answers different questions. Preserve the complete label, such as “highest forecast gust during this period”, rather than shortening every column to “wind”.
Do not mix a new forecast with an old screenshot
If you save a forecast screenshot while planning an event, add the date saved, the forecast issue time where available, and the period covered. Reopen the current source when returning to the plan. You can keep both versions to examine what changed, without treating the earlier forecast as an observation of something that subsequently happened.
When sharing the screenshot, include enough context for another person to identify its period and location. Removing those details may create apparent certainty from an outdated or unrelated value. If you cannot recover the missing context, say so and consult the current source rather than reconstructing it from memory.
Turn the numbers into a precise question
Replace “is that a large number?” with a specific question: did the mean change between two periods; did gusts change while the mean remained similar; or did the direction of origin shift? These questions use different columns. Do not compress them into a made-up score that the source does not define.
If contacting an activity organiser, pass on the values with their source and time, then ask about the organiser's applicable instructions. This table cannot establish whether particular equipment is suitable. Reading the information correctly helps frame a decision; it does not replace an assessment of the activity and conditions.
A compact comparison worksheet
- Write down the location and period you are asking about.
- Identify observation or forecast, including issue or observation time.
- Put mean speed and gust information in separate columns.
- Copy each original unit and add conversion columns only where needed.
- Write the direction of origin in words and consult the interface legend for arrows.
- Read local alerts and activity instructions at their sources instead of inferring them from the arithmetic.
Finish with one unresolved question. Perhaps the gust period is not explained, or the station location is unclear. That gap is part of the result, not something to hide. When you locate an answer, save the explanatory link so that the next comparison does not require the same research again.
Frequently asked questions
Can a windsock picture supply a wind speed?
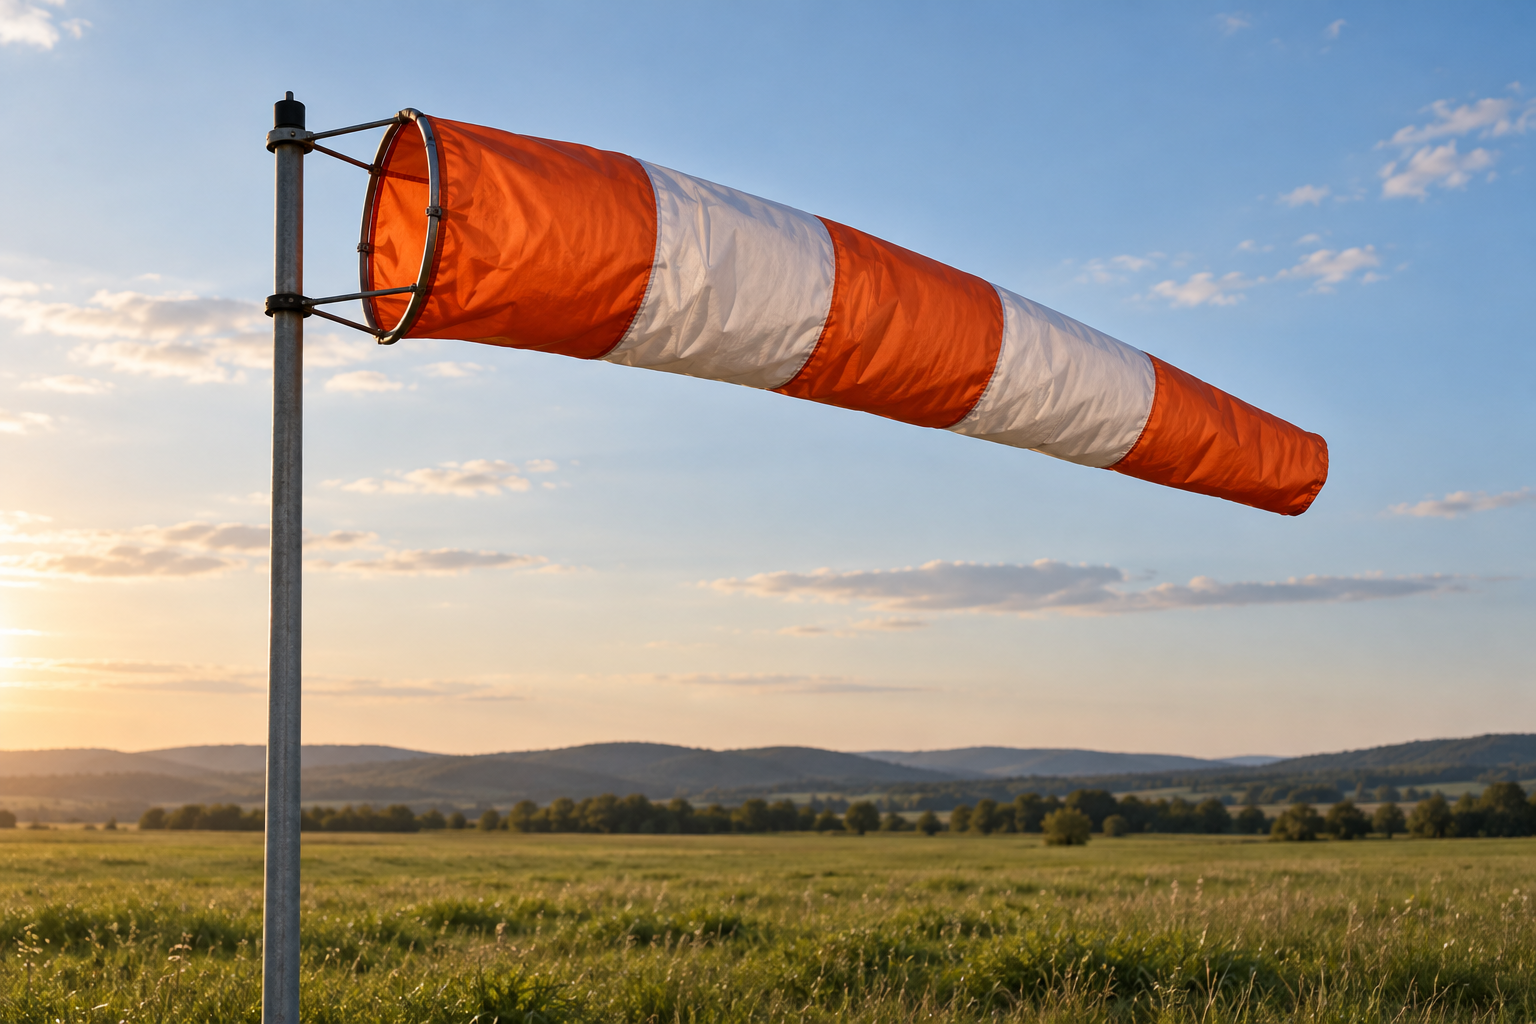
The accompanying image is a generated illustration of a windsock in a field, not a documented instrument reading. We assign no speed to its fabric shape. Do not use it as a measurement or an operational instruction.
Why does a discrepancy remain after conversion?
First check location, period and value type. If a discrepancy remains, retain it and inspect the providers' documentation. Two numbers alone cannot identify its cause, and agreement with your personal expectation does not establish which service is more accurate.
Should I subtract the mean from the gust?
You can compute a numerical difference if units and periods are compatible, but do not name it an official index unless the source defines one. In the example of 15 and 10 m/s, the difference is 5 m/s. That does not automatically translate into a danger level or an activity decision.
Sources and method
The Met Office guide to measuring wind supports the direction convention and measurement context. Its forecast interpretation guide explains displayed fields and the arrow/origin distinction. Both were consulted on 1 November 2026 and come from the same organisation. The conversions, numbers and worksheet were developed as educational examples, not copied observations. The image is generated and represents no documented weather event. This AI-assisted content has not received independent human editorial review.