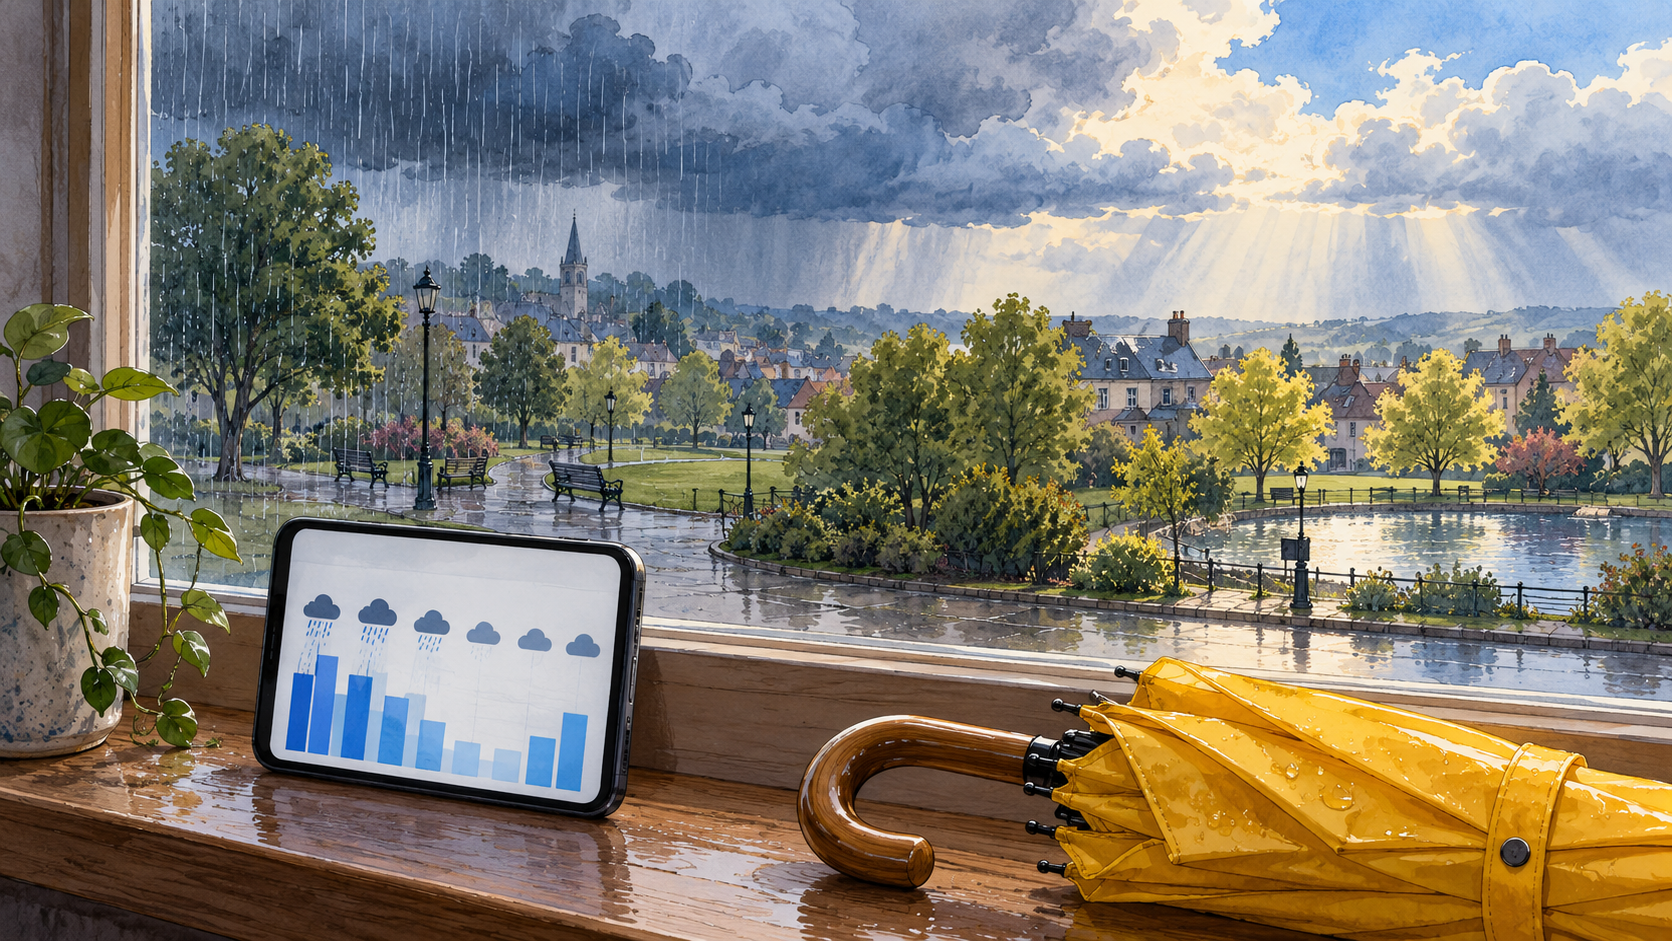
A rain icon and percentage in a weather app can raise several questions: will rain last all day, and does the percentage describe an amount or a chance? Reading a forecast starts with its location, time interval and indicator definition, not just its number. Missing one of these can lead you to interpret a correctly labelled forecast in a way its source did not intend.
This guide explains forecast displays, not current weather or the safety of an outdoor activity. Its examples are hypothetical and refer to no actual city or date. Decisions involving hazards and alerts require the relevant weather service and responsible authorities for your location; this explanation does not replace their instructions.
Start with four questions before reading the percentage
First identify the forecast location. Have you selected the right city, a similarly named place or a station far from your intended destination? Next establish the date and interval: one hour, several hours or a daily summary. Then find the update time and displayed units. Record these elements when comparing two apps.
A city name does not replace every detail about location. If your activity is elsewhere in the area, check the appropriate place in the available source. A midday forecast does not automatically describe the evening either. Distinguishing place from time prevents many unequal comparisons.
Write a simple reading statement: “This forecast concerns the selected location, covers the stated interval, and was issued or updated at the displayed time.” Leave an unknown element as an open question rather than guessing. You do not need to become a meteorologist, but you do need to know what the number you are using describes.
What does precipitation probability mean?
The National Weather Service precipitation probability sheet describes a measurable amount at a point within a specified interval, not simply a fraction of time or area. Published products have definitions and thresholds; check the relevant product rather than transferring one source's explanation automatically to another.
An invented 40% probability for a known interval does not mean “rain for 24 minutes of every hour.” That calculation multiplies a percentage by time without following the indicator's meaning. Nor does it mean 40% of some assumed complete rainfall quantity: the display supplies no such total from which to calculate an amount.
Probability alone does not establish intensity or the starting time within the interval. Use it to begin reading other details, not replace them. Look for amount, description or shorter intervals. If the source does not provide them, acknowledge that the available information does not answer the question instead of manufacturing an answer from the icon.
Separate probability, amount and the icon
| Element | Question it helps answer | What it does not establish alone |
|---|---|---|
| Precipitation probability | What chance is shown under this source's definition and interval? | Exact duration or amount |
| Forecast amount in a stated unit | What quantity does the product display? | A guarantee of that amount at every point |
| Weather icon | What summary has the source chosen? | A detailed description of every minute |
| Update time | Which forecast version am I reading? | That old information remains the latest |
| Time interval | Which hours does the statement cover? | That hourly and daily indicators are interchangeable |
The Met Office forecast-reading guide distinguishes instantaneous fields from interval-based icons and probabilities in its display. Read that product's interval and threshold definitions rather than treating one display convention as universal.
When recording an amount, keep its unit and interval. “5” alone is insufficient. You might note that an invented figure uses millimetres for the stated interval, then check whether the display means an interval total or something else. Do not add figures before establishing that they represent separate intervals and that addition suits the source's method.
A reading exercise, not a weather prediction
Imagine two teaching cards unrelated to actual weather. One displays a 70% probability for a morning interval, the other 30% for an evening interval. You can say that the displayed probability is higher on the first card under their definitions. You cannot infer from those percentages alone that morning rainfall amounts will be larger or that the evening will definitely be dry.
For a hypothetical garden photography plan, the practical question is not only “Which number is lower?” but “What information does this choice require?” That might include the time description, a fresh update before leaving and flexibility over a nonessential plan. This is an example of organising information, not a statement that an activity is safe at a particular probability.
Preserve uncertainty in your wording: “The current forecast shows a lower probability for the second interval, and I will check the update before choosing.” Do not replace that with “It will not rain in the evening.” The distinction prevents a probability from turning into a promise.
Compare two apps without manufacturing a misleading average
If one app displays 40% and another 60%, do not begin by declaring their average of 50% more accurate. First match location, date, interval, update time and indicator definition. You might be comparing one hour with three hours, a recent issue with an older one, or two different points. Arithmetic averaging does not automatically repair those differences.
After matching the fields, record the difference and seek the source's explanation. Do not attribute it to a particular technical cause without evidence. The screens show a disagreement, but may not reveal which model or processing method was used. Several apps relaying the same source are not necessarily several independent pieces of evidence.
For ordinary use, a main source whose symbols and updates you understand can be useful, with official authorities consulted when needed. The aim is not to monitor ten screens continually, but to know where definitions and updated information are available. Prefer clarity about the information supplied over appearance alone.
Treat an update as a new version
Record when you viewed a forecast for a future plan. If it later changes, compare the versions with their timestamps instead of saying the app displayed contradictory numbers at the same instant. Updating is part of forecast delivery, although that does not automatically explain every discrepancy. Describe what you actually observed accurately.
A teaching log can have four columns: viewing time, target interval, displayed value and later observation. Two or three experiences do not constitute a scientific test of an app's accuracy. Evaluating probabilities needs suitable data and methods. Your log can clarify reading habits and mistakes without ranking forecast sources definitively.
Common reading errors worth checking
- Treating a percentage as the part of the day during which rain will fall.
- Taking one icon as a detailed description of every hour.
- Comparing different locations or intervals without recording them.
- Confusing the forecast's target time with its update time.
- Presenting an old screenshot as live information.
- Taking a low probability as clearance for a safety-sensitive activity.
When sharing a forecast, include the source link, time and location instead of cropping out everything except the number. A crop may remove the interval that makes the information meaningful. Explain a changed plan as a decision based on information that can change, not on an app's guarantee.
When this guide is not enough
If the decision involves an official warning or a hazard to people or property, do not substitute the examples or percentage comparison for the responsible authority's information. This article supplies no emergency instructions, dangerous-condition crossing guidance or planning rules for sensitive activities. It explains forecast language, not on-site risk.
It also does not report today's weather in your country. Every number is labelled hypothetical, and the generated illustration documents neither an actual cloud nor a real location. Keep stable educational material separate from changing observations that require explicit times and sources.
Questions that sharpen interpretation
Does no rain automatically mean the probability forecast was wrong?
One case cannot support a comprehensive judgment of a probabilistic system. The outcome at your location matters to your record, but it does not erase the fact that a forecast expressed a probability rather than certainty. Record what happened and when separately from your evaluation. Do not reinterpret the percentage afterward as a promise that went unfulfilled.
Can I derive a daily probability from scattered hourly values?
Do not add the percentages or choose the highest and present that as the source's daily definition. Display published values with their intervals, or use a daily product that explains its method. This preserves the difference between published information and a reader's calculation made without knowing relationships between intervals. Statistical analysis is a separate task requiring stated assumptions.
Sources and method
The linked National Weather Service sheet and Met Office guide were read on 1 November 2026. They inform indicator definitions and interval limits; the worksheet, hypothetical examples and comparison workflow are original. This content was prepared with AI assistance and has not received independent human editorial review.