A weather app can show high relative humidity on a cold morning and a lower percentage on a warmer afternoon. That does not, by itself, prove that most of the water vapour has disappeared. To understand the figures, read humidity alongside temperature and dew point, then check that all the values refer to the same place and time.
This guide is about reading and recording weather information. It is not a forecast for a particular city, a health recommendation or a standard for setting indoor humidity. The examples are educational rather than actual observations. The aim is to separate what a screen tells you from what remains unknown.
Read three fields together
Relative humidity is a percentage comparing the water vapour present with saturation at the same temperature. It therefore depends on temperature as well as moisture. Dew point is the temperature at which air reaches saturation when cooled at constant pressure and moisture content. The US National Weather Service explains these concepts and how a higher dew point indicates more atmospheric moisture.
Keep the units visible. Relative humidity carries a percentage sign; temperature and dew point use temperature units, such as Celsius or Fahrenheit. “Dew point 18” is incomplete without its unit. If a screen says “humidity 70”, confirm the field label before assuming what the number represents.
| Field | What to record | Check before comparing |
|---|---|---|
| Temperature | Value and unit | Celsius or Fahrenheit? |
| Relative humidity | Percentage | Does it refer to the same hour? |
| Dew point | Value and temperature unit | Does its unit match the temperature field? |
| Place and time | Station or location and timestamp | Observation or forecast? |
Why two percentages are insufficient
A change in temperature can change relative humidity without a corresponding change in the amount of water vapour. Comparing 80% in a cold location with 50% in a warm one therefore does not establish that the first location contains more moisture. The National Weather Service explanation highlights dew point as useful context for this comparison.
Leave space for missing data in your notes rather than filling it with a guess. If you have only two percentages, write “insufficient information for this comparison”. Then look for temperature and dew point associated with each value. Preserve the original location, hour and units while gathering the missing fields.
Identify the report before interpreting the number
Open the app details or weather-service page and record the location actually displayed. You may have searched for one town and subsequently switched to a saved location. Choose a clear reference point for a daily comparison; if you change it, note the change. When a page identifies an observing station, retain its name or identifier instead of replacing it with a broad regional label.
Next distinguish the page-update time from the observation time or the period covered by a forecast. The current time on your phone does not prove that the weather values were collected at that moment. Record the date and time supplied by the source, including the time zone where available. Comparing tomorrow's forecast with today's measurement does not establish an error in either service.
Keep observations and forecasts separate
Add a column labelled “observation” or “forecast”. If your eventual question is how a forecast compared with a later observation, save the original forecast with its issue time and add the observation later. Do not overwrite the first value: doing so removes the evidence needed to examine your question. This is a suggested recordkeeping method, not a test proving the accuracy of any provider.
A worked recordkeeping example
Consider Layla, a fictional learner who wants to understand why her weather screen looks different in the morning and evening. On the first day she writes only “high humidity”. Later, she cannot identify a value or timestamp. On the next day she records the source, time, temperature, percentage and dew point.
Her notes now support a better question, but they have not become a reliable climate study. She divides each entry into four lines: what values were reported; what changed between entries; what information is missing; and what conclusion the evidence actually supports. If dew point is absent, she marks it absent. If the station changed, she does not attribute the difference solely to the passage of time.
You can use the same approach without copying her schedule. Define your question first. A comparison between two locations at one time needs a different record from a comparison of one location across several times. A simple sheet that answers a precise question is more useful than an unstructured collection of screenshots.
Use calculators without inventing inputs
The National Weather Service calculator linked below has named input fields and unit choices. Its page also asks for actual station pressure for calculations that use it. Read the labels rather than placing any available pressure value into the field. An unexplained default should not silently become a measured input.
Before using a calculator, write down the quantity you want to find and the inputs you actually possess. A lone relative-humidity percentage should not be turned into a precise-looking answer by guessing everything else. Save the tool's link, inputs and units so that someone can repeat the calculation. Describe an approximate educational result as an estimate produced by that tool, not a new field measurement.
Extra decimal places do not repair missing evidence
A result with many decimal places is still limited by its inputs. Do not add decimal places to a copied observation and imply improved accuracy. Keep the original value and put any conversion in a separate column. This makes a unit mistake or transcription error easier to trace than searching through unrelated screenshots.
What condensation on a cold glass illustrates
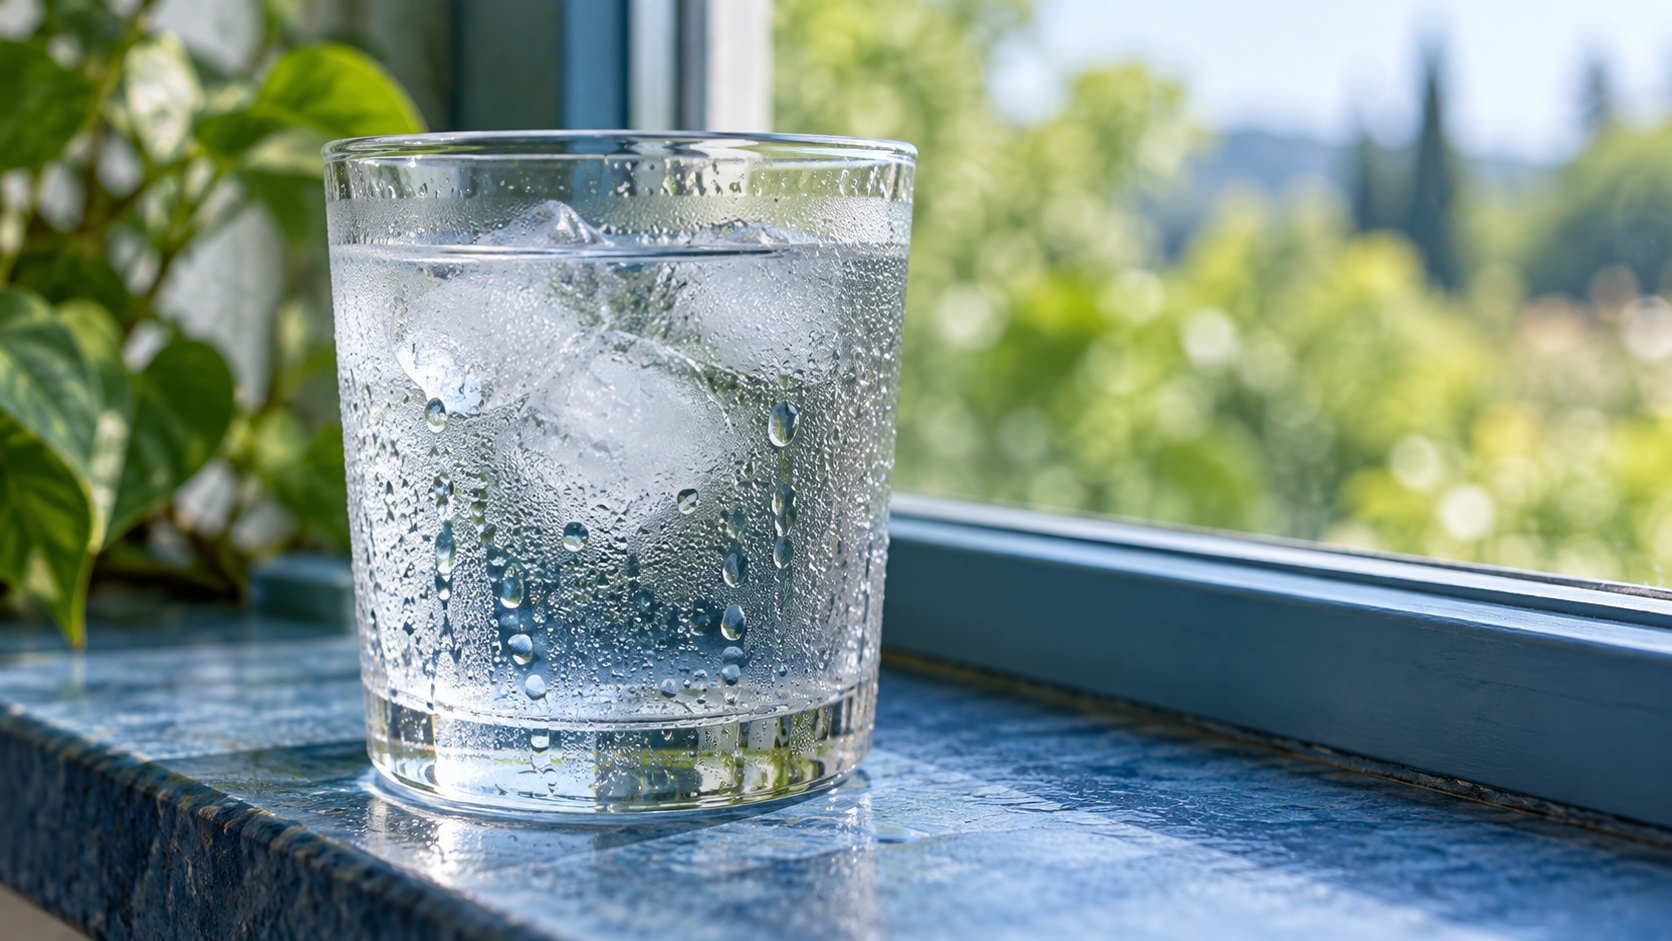
The accompanying generated image shows droplets on the outside of a chilled glass. It illustrates condensation at a cold surface; it does not show a humidity-measuring instrument. You cannot derive a reliable percentage from the size of the droplets in this image or in a similar photograph sent by a friend.
When using this picture in a presentation or a conversation with a child, distinguish observation from measurement. The illustration depicts droplets, but it supplies no measured surface temperature, air temperature or documented instrument reading. This keeps the visual useful without turning it into supposed quantitative evidence.
Five common reading mistakes
- Comparing humidity percentages without temperature and context.
- Recording dew point as a percentage instead of a temperature.
- Overlooking a Celsius/Fahrenheit difference between sources.
- Mixing a station observation with a forecast for another place or time.
- Treating an old screenshot as a description of current conditions.
To investigate a disagreement, first compare the records field by field instead of immediately downloading another app. Align location, time period, unit and report type. If the values still differ, retain that difference and look for the providers' explanations. You do not have to declare a winning number when the available information cannot explain how each value was produced.
A reusable six-step worksheet
- Write a narrow question: two times at one location, or two locations at one time?
- Record the source, link, location and report type.
- Copy temperature, relative humidity and dew point with their units.
- Identify the report's date and time, and mark missing fields explicitly.
- Describe differences before suggesting explanations; leave unsupported interpretations unresolved.
- Preserve the original record when converting units or adding later observations.
A sheet of paper or a basic table is enough. Choose a monitoring period that serves your question, then review what the notes actually taught you. Do not label a short personal record a climate study or generalise its findings to an entire year or region.
Frequently asked questions
Can I predict rain from humidity alone?
This guide does not offer a method for predicting rain from one percentage. For a precipitation question, consult the relevant forecast and its valid period instead of substituting an inference from another field. Read the name of each forecast element before comparing it.
Does outdoor weather describe my room?
Do not treat an outdoor observing location as a measurement taken inside your room. An indoor question needs appropriate indoor data and an identified measurement method. This article does not diagnose health concerns or specify home-appliance settings.
What if dew point is missing?
Mark it unavailable and check whether the source provides it in a detailed view. You can retain the other fields without pretending the comparison is complete. Do not borrow a value from another town or invent one to make the table look finished.
Sources and editorial limits
We consulted the National Weather Service humidity and dew-point explanation for definitions, its surface-observation page and field descriptions for data structure, and its humidity calculator for input labels and unit choices on 1 November 2026. These are three pages from the same organisation, not three independent organisations. No live observations were reproduced. The worksheet and fictional learner example were developed for this guide, and the image is generated illustration. This AI-assisted content has not received independent human editorial review.